Virtualitics: a B2B AI data analysis platform built on 3D visualization
Virtualitics is a startup funded by CalTech Lab working with NASA & Fintech. Virtualitics, and their goal is to improve workplace relationships by focusing predictive AI models, and leverage exploration and collaboration in data analytics space.
Visit company site ↗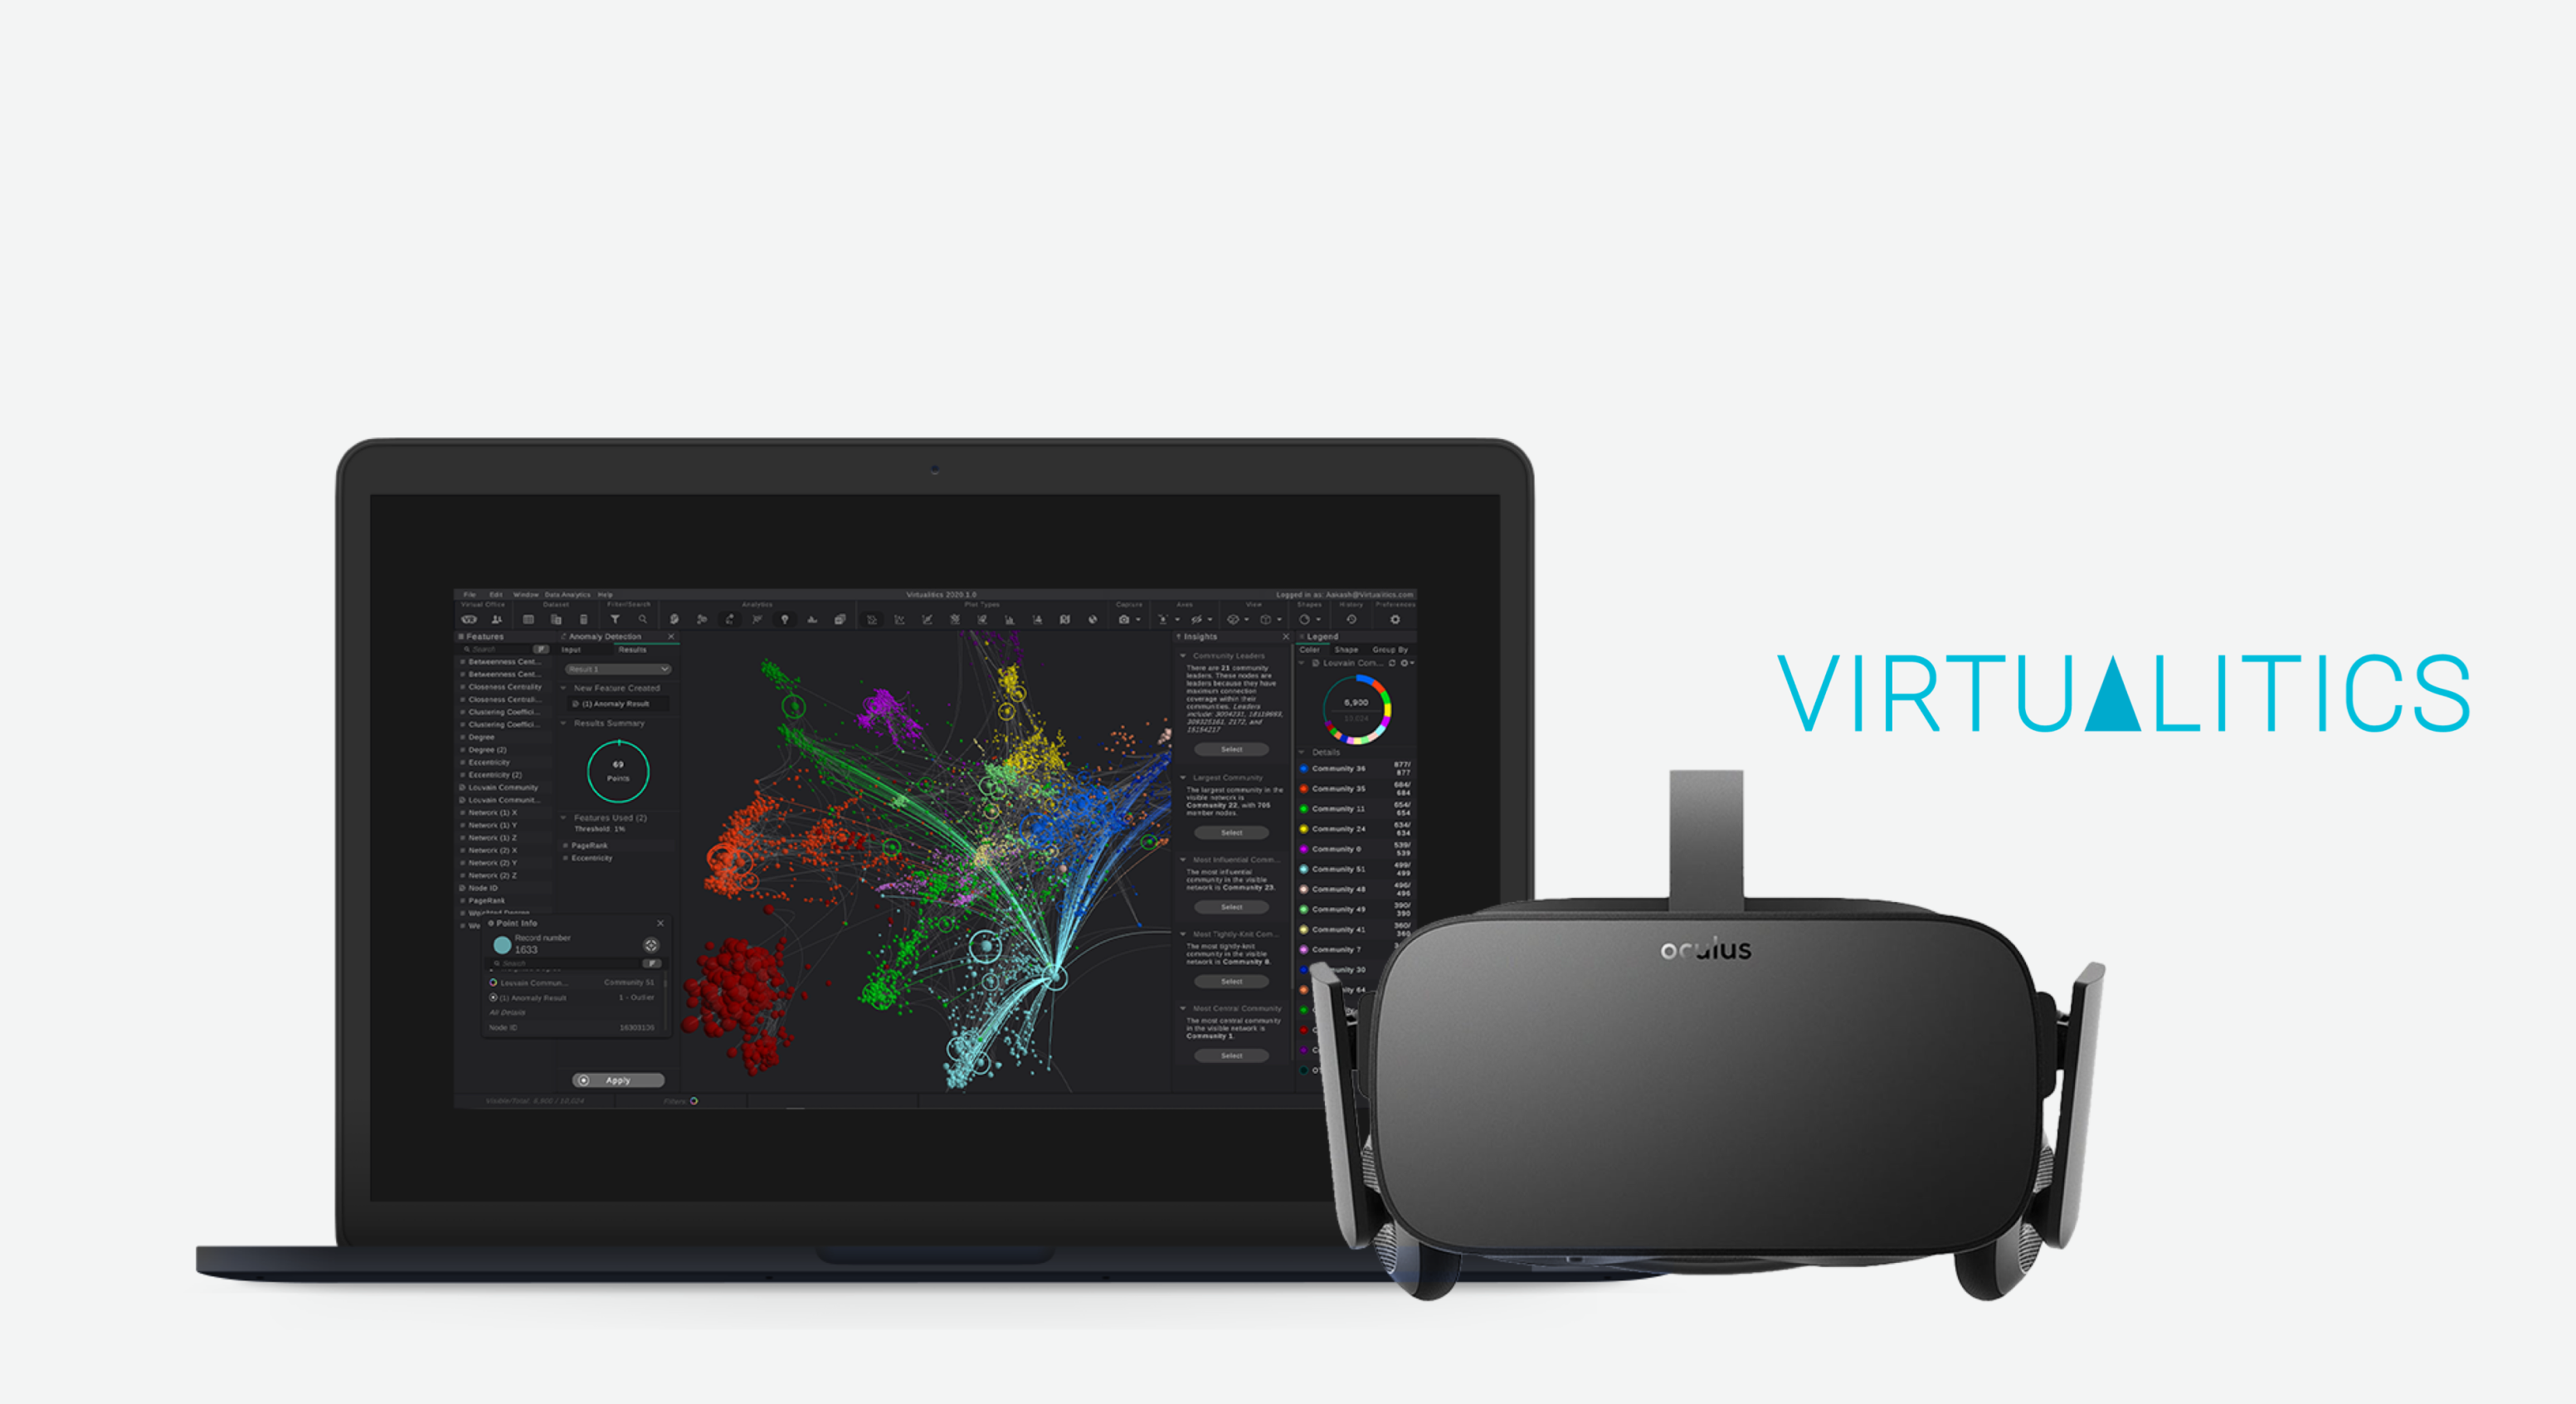
Context
What is Virtualitics?
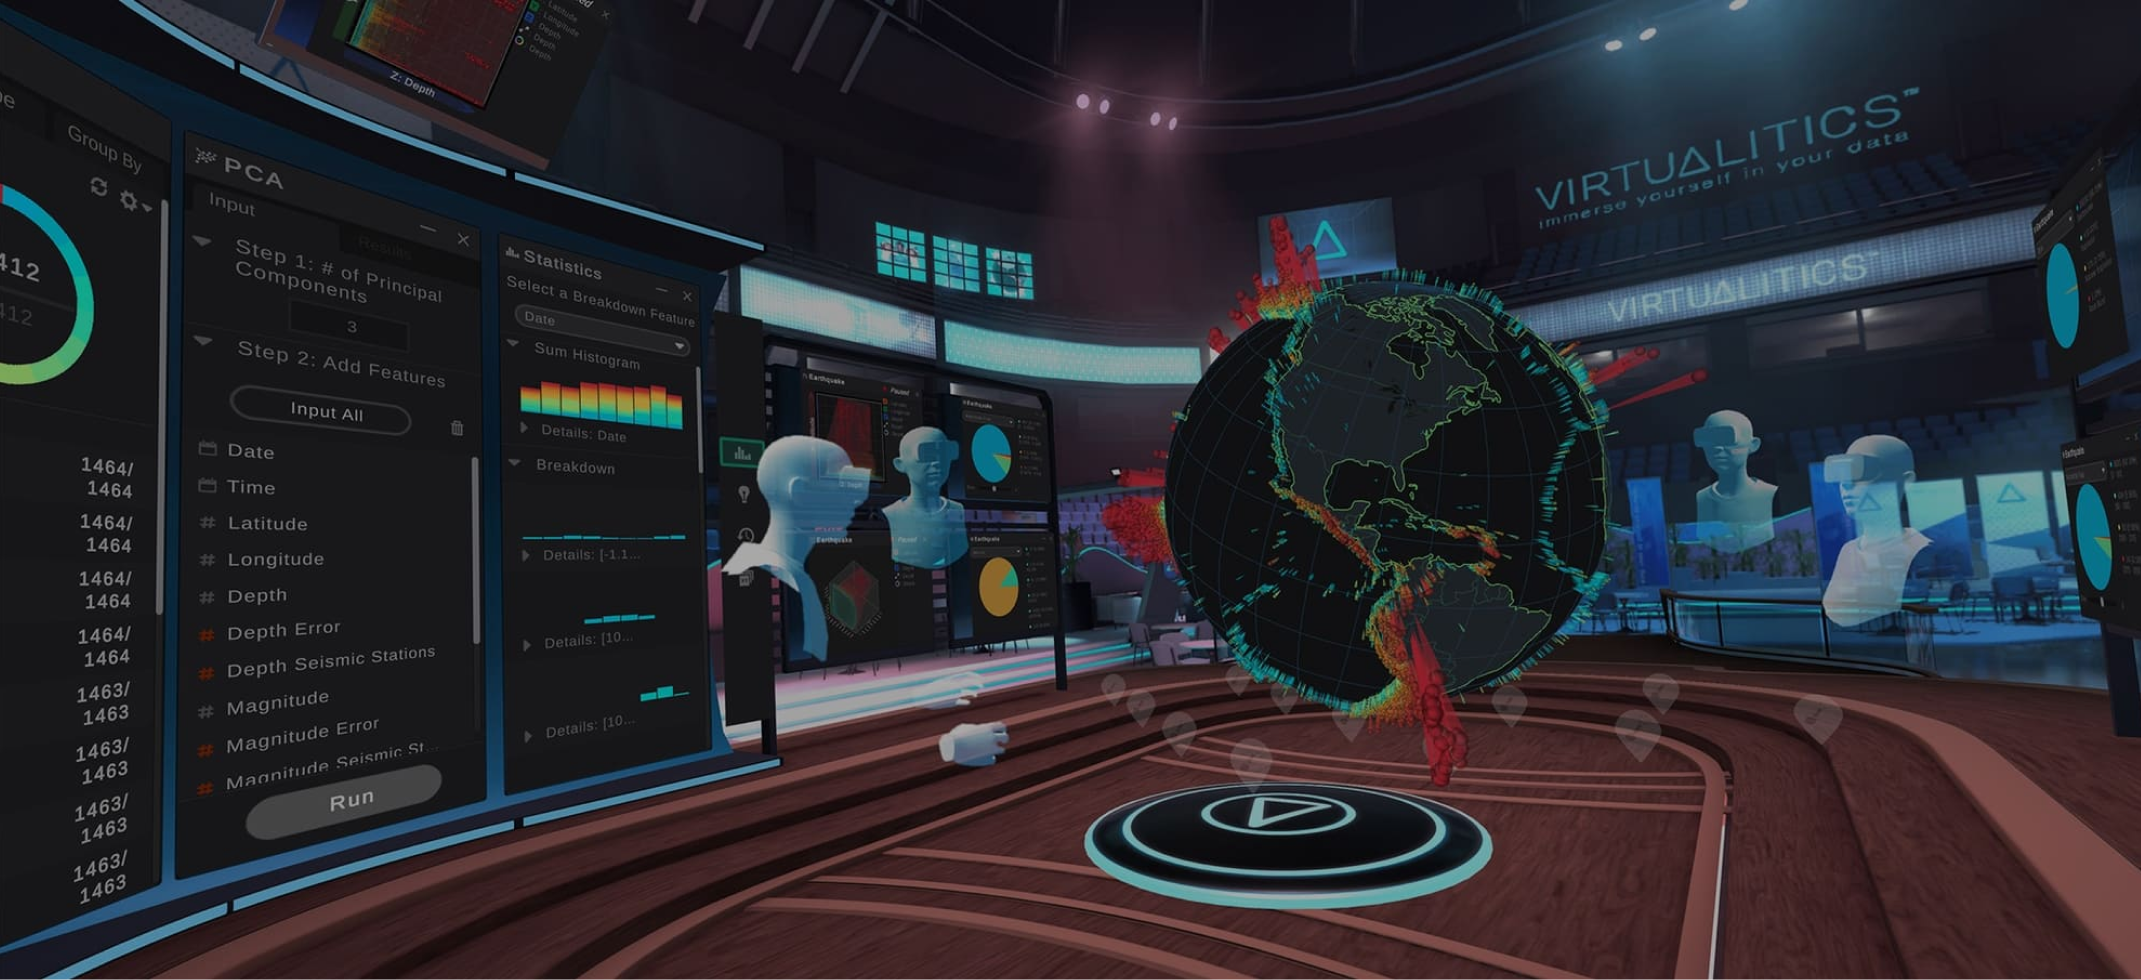
Virtualitics is a startup founded by NASA employees and funded by CalTech Lab. Virtualitics, and their goal is to improve workplace relationships by focusing predictive AI models, and leverage exploration and collaboration in data analysis space.
My work
Startup work during a 10-month internship
1. Innovate multiple data visualization graphs using our platform 2. Quantitative Research on new features 3. Create & lead image capture tool from scratch to final implementation 4. Design system consistency 5. Scientific Research papers 6. Marketing website design 7. User testing with Q & A 8. Workshop Presentation 9. Detailed specs across platforms 10. VR design assistant
Project 01
Data image sharing tool
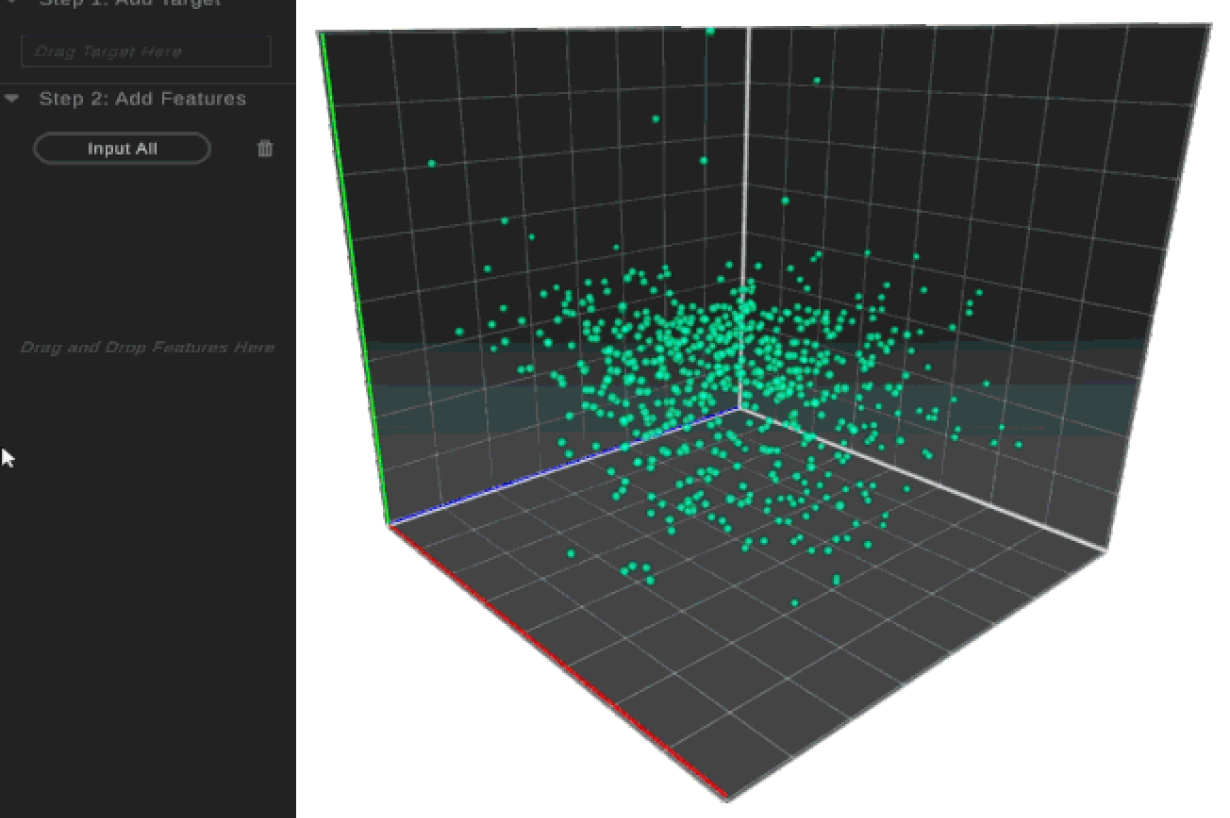
During my 10 months internship, Image capture tool is what I led from scratch to final implementation. This project was successfully delivered to out client within 2 months. I worked with our engineer team & QA from multiple iterations to final deliverable to our clients.
Our client
We have one main target users to use our platforms. The predictive visualization that data analysts generate 3D visualization is extremely important, which is why they became our main user types.
Goal
Data scientists can grab insights from big data efficiently through AI and visualization

Client feedback
“Virtualitics has not only helped us to save time but has allowed us to seamlessly identify critical business insights”
Build a data sharing solution from scratch
I found that data scientists are now using low quality output image export tools from 3rd parties. The outcome is not optimal for them to present and share with their team. Data are seen from different perspectives and there is no way for them to see it frame by frame.

Quick sharing to others without third-party image captures

Quick sharing to others without third-party image captures

Quick sharing to others without third-party image captures

Quick sharing to others without third-party image captures
Problem
A tool acquired from bank clients to help their internal presentations and data sharings
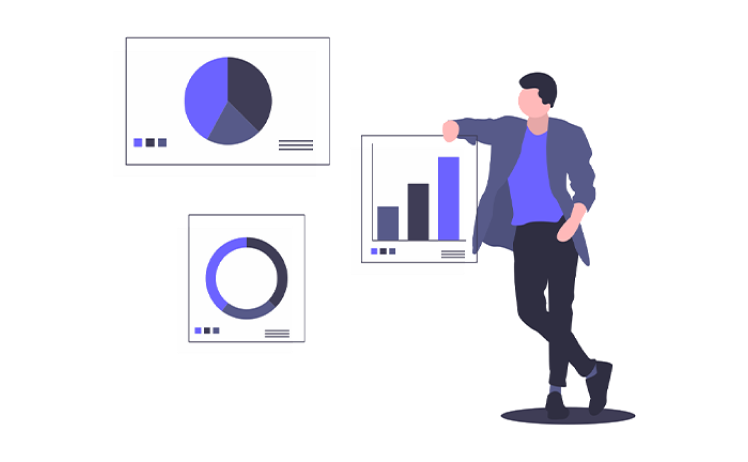
Not able to export high quality visualization sharing
90% business clients use 3rd party tools to share data result on our platform but they have increasing need to share 3D data visualization graphs with their colleagues. It turns into low quality images now.
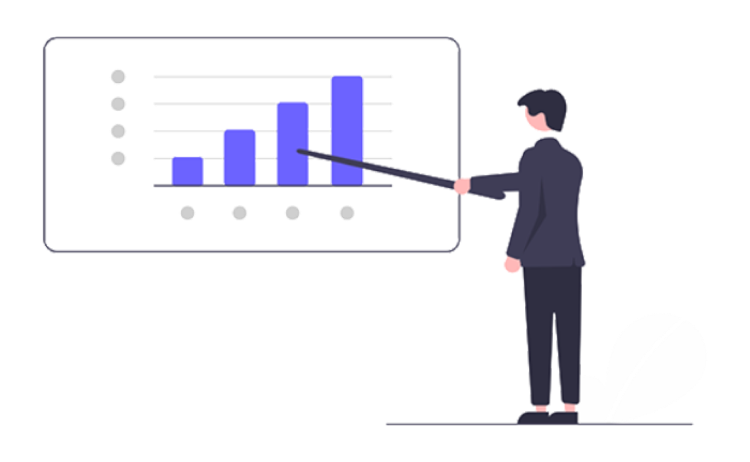
Cannot share from multiple 3D perspectives
Most of our enterprise customers use our software to present with their clients. They want to share from different 3D perspective. Key insights of data are not just from one point, it is about mixing & comparison.
Research
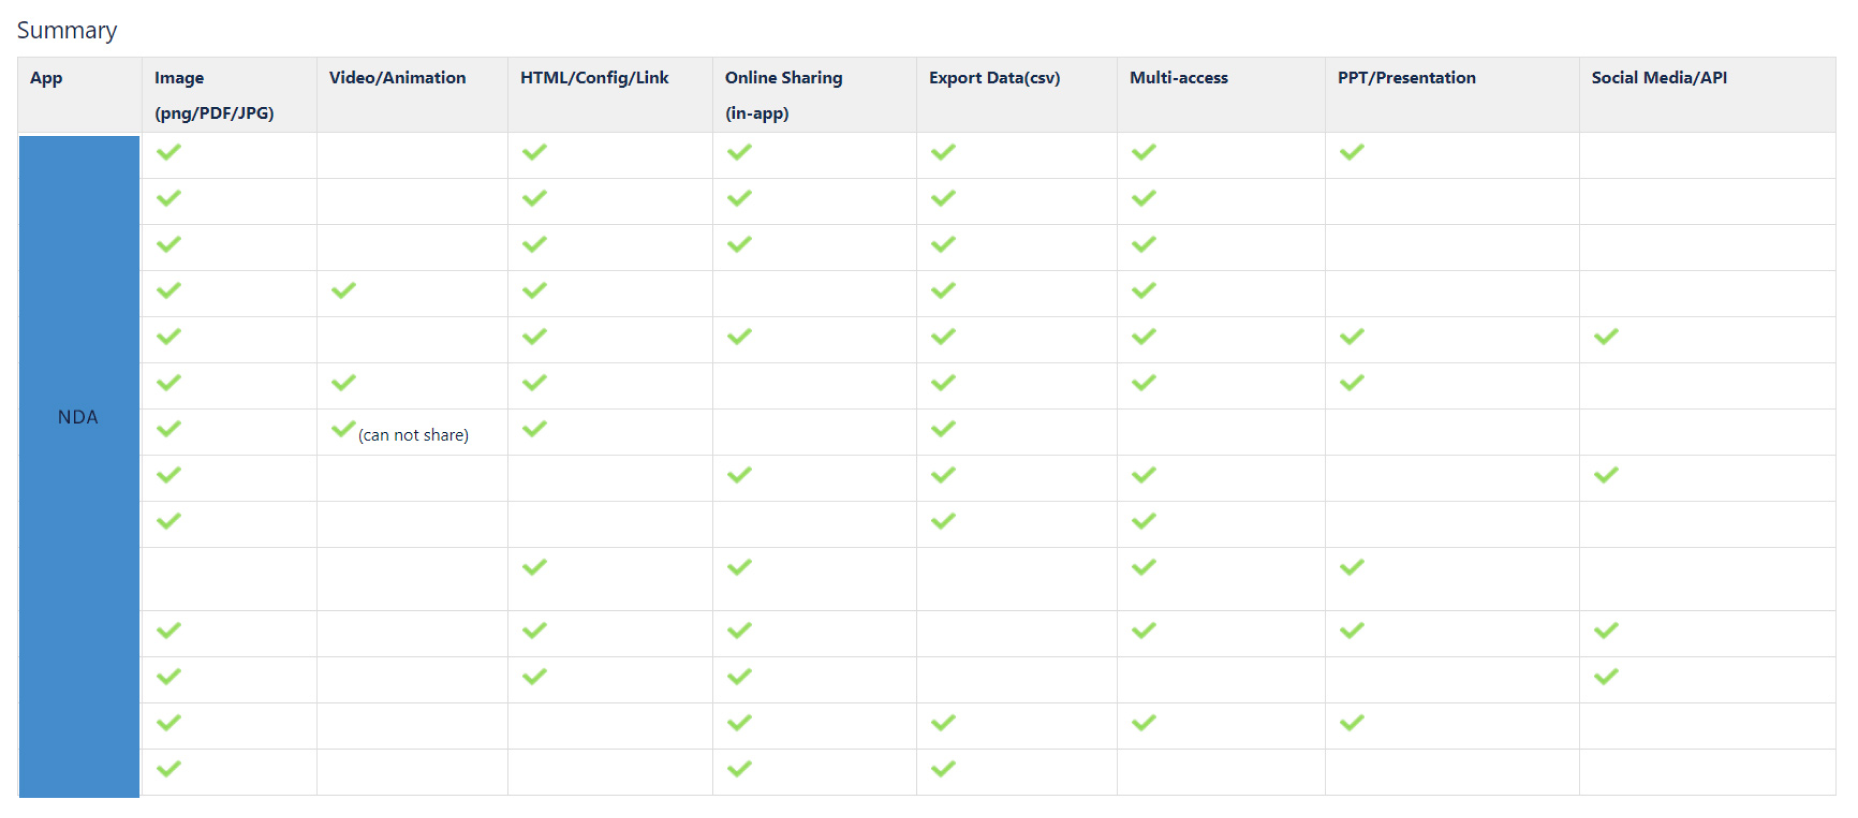
20+ competitive analysis and flow breakdowns
In the market, I found that most data analysis softwares do not accept interactivity with the graph when they export their image. But I also learnt that sharing image is not an easy tool to use and it requires a step-by-step critical moment during the journey.
Define MVP: comprehensive feature list
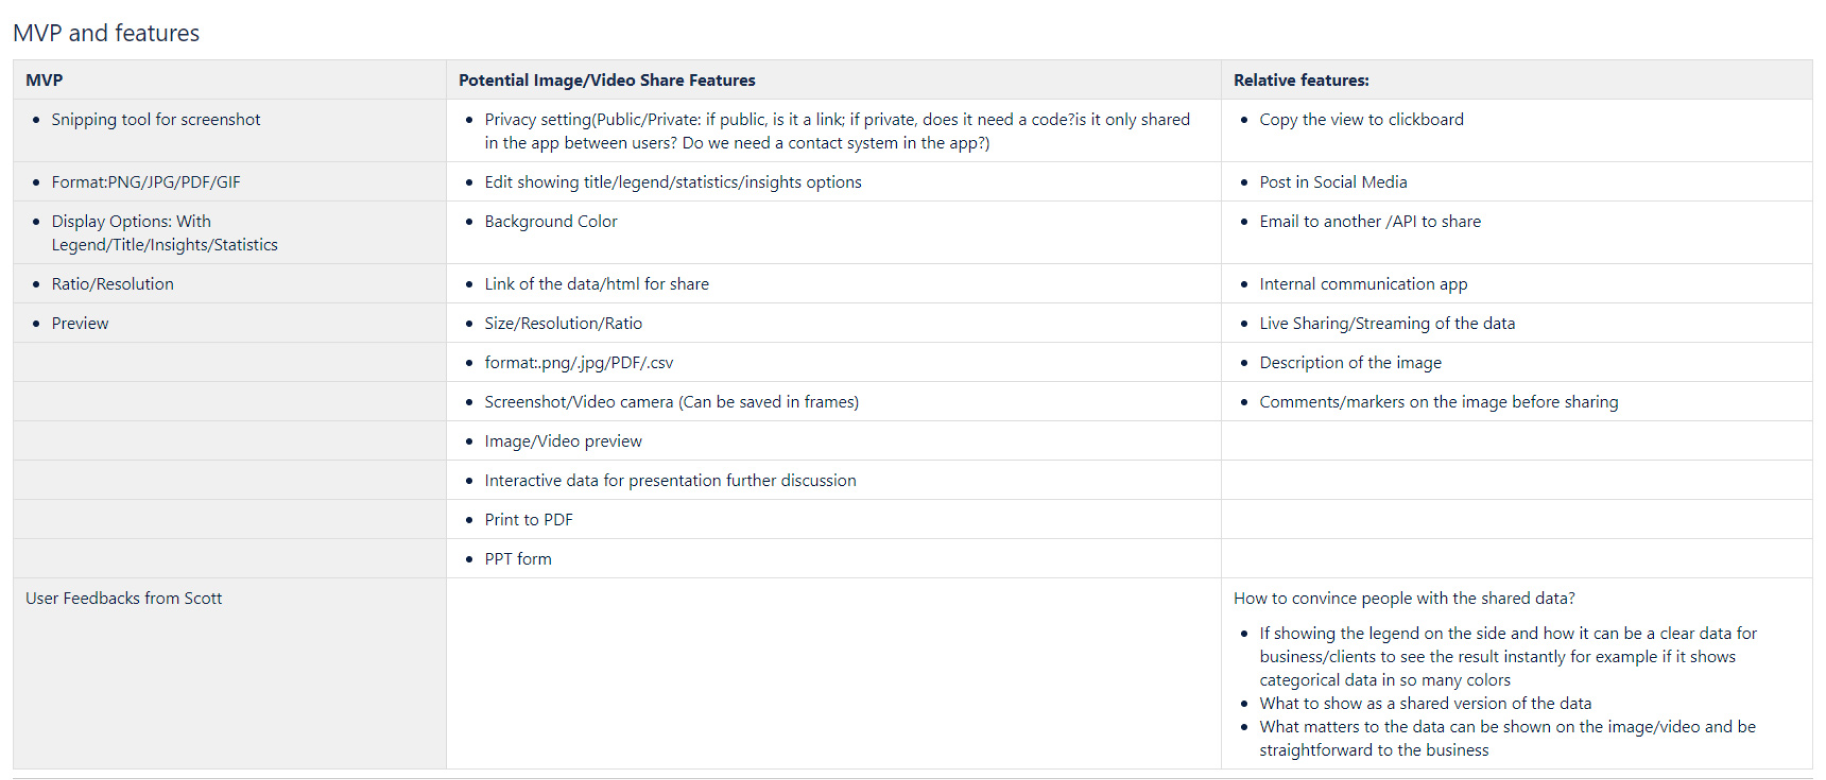
Define MVP: narrow down to a screenshot tool
User needs
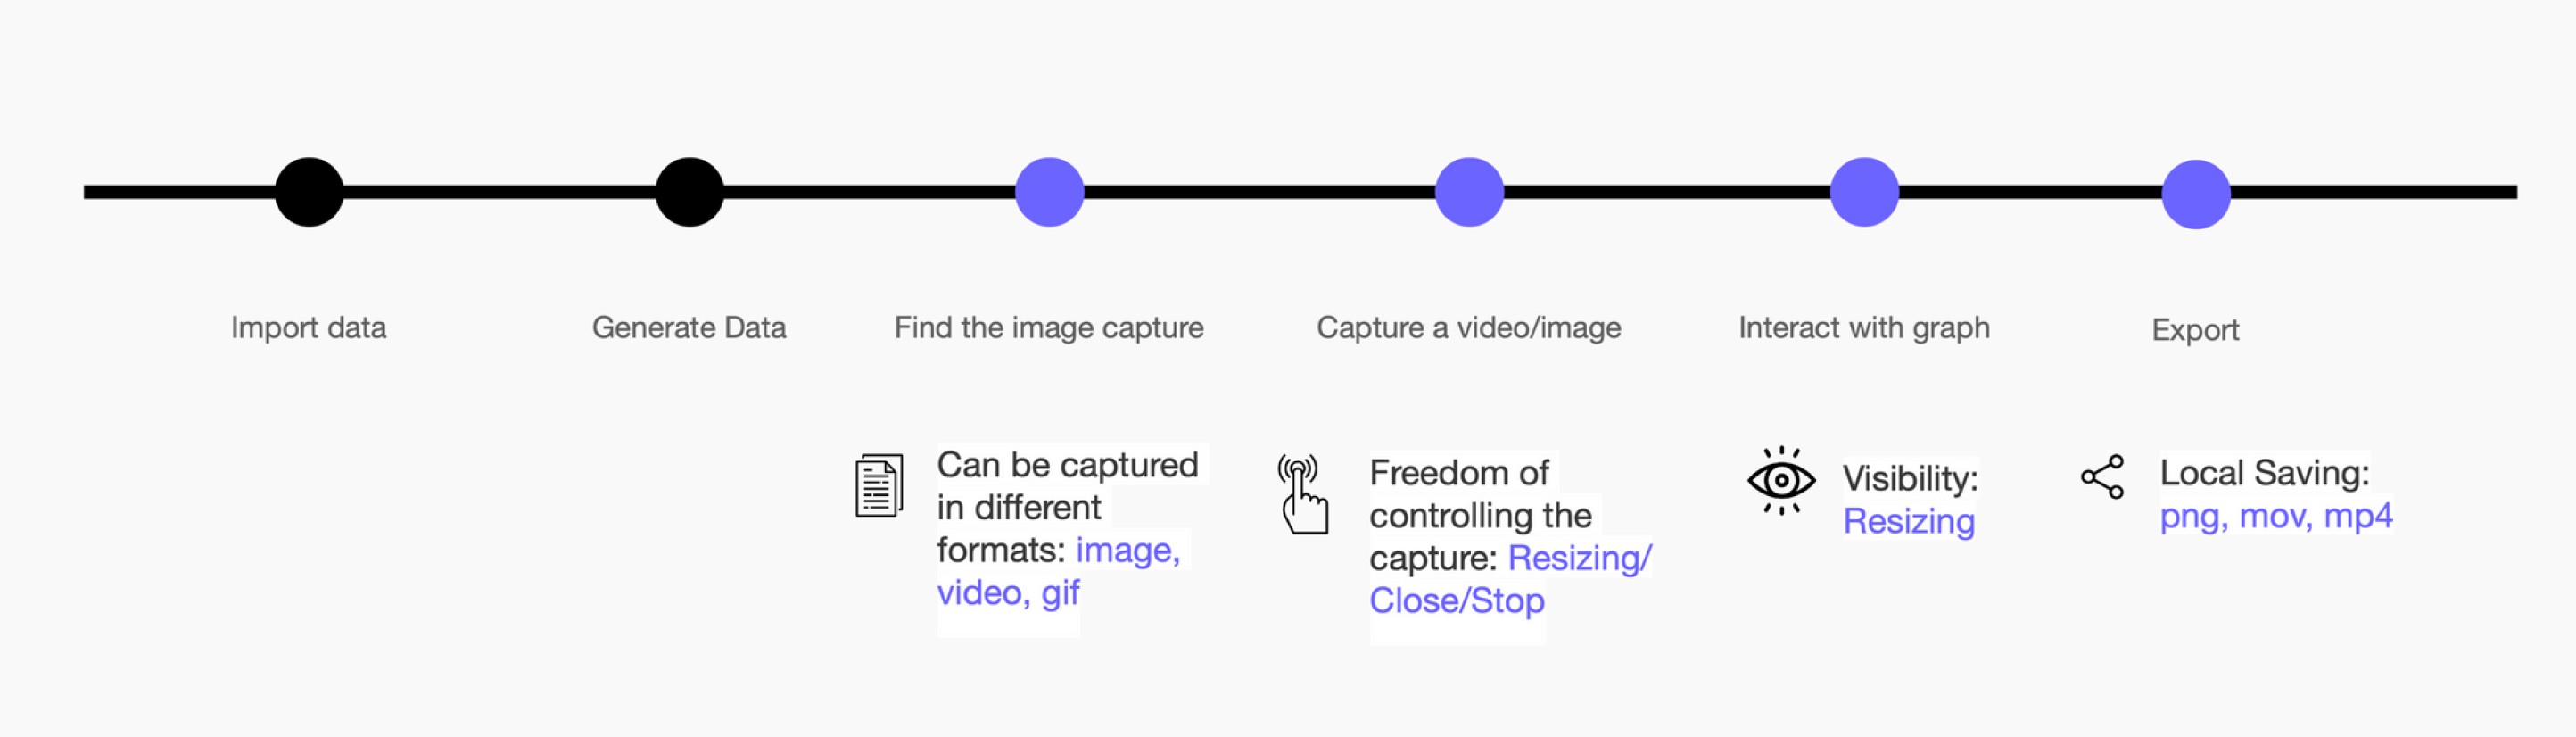
Understand the user journey & needs
Let’s say I helped a data scientist to create this tool during his analysis presentation day
1.
Can be captured in different formats: image, video, gif
2.
Freedom of controlling the capture: Resizing/Close/Stop
3.
Visibility:Resizing
4.
Local Saving: png, mov, mp4
UI iterations
UI iterations
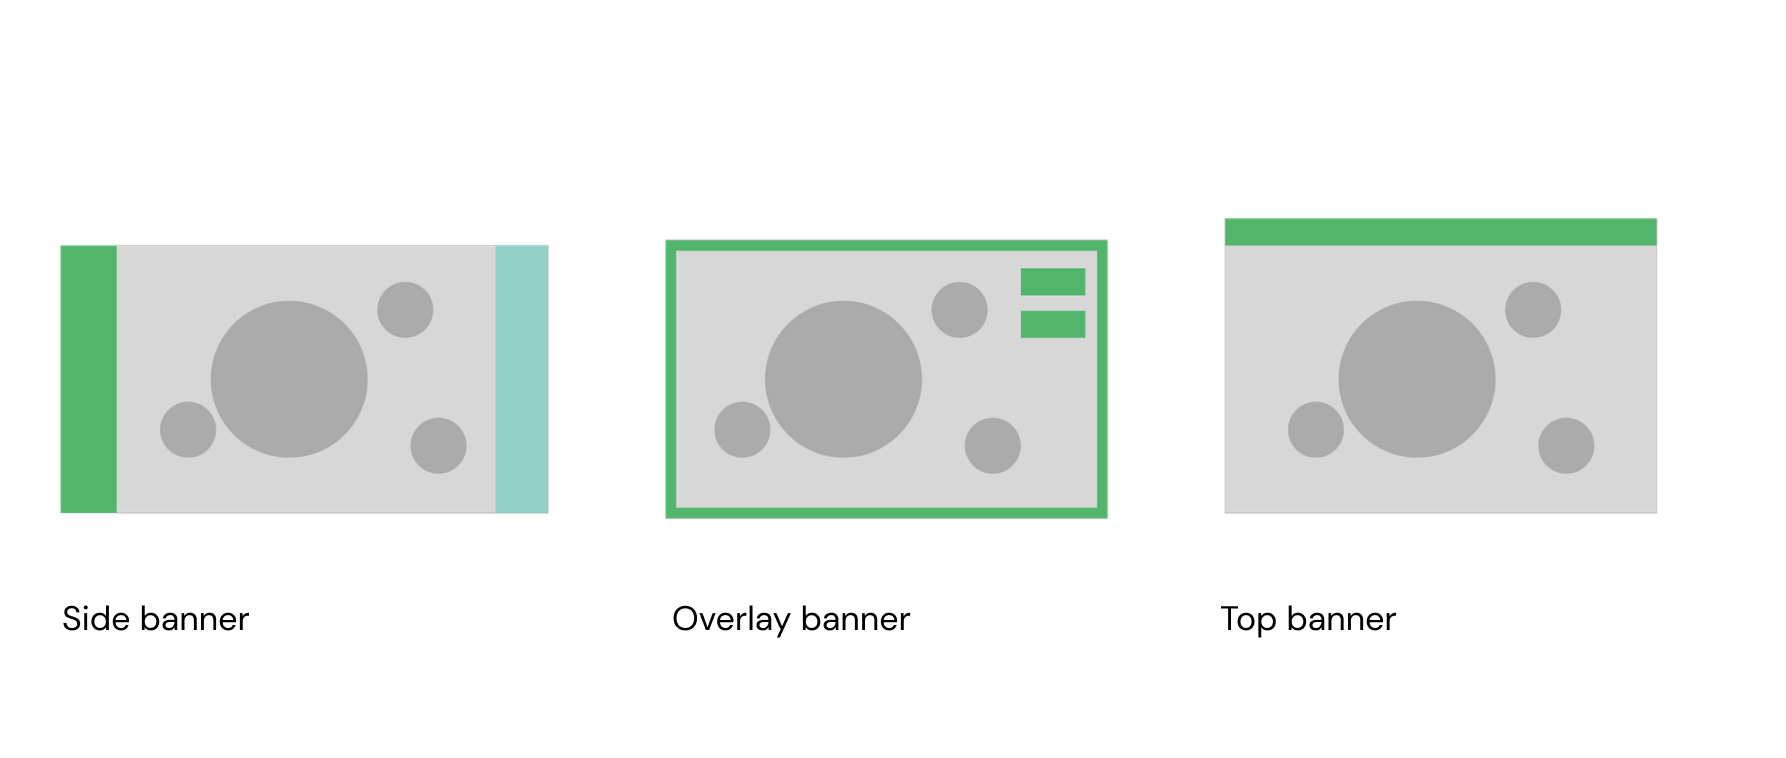
Top banner for system consistency
Simplified export settings
Before
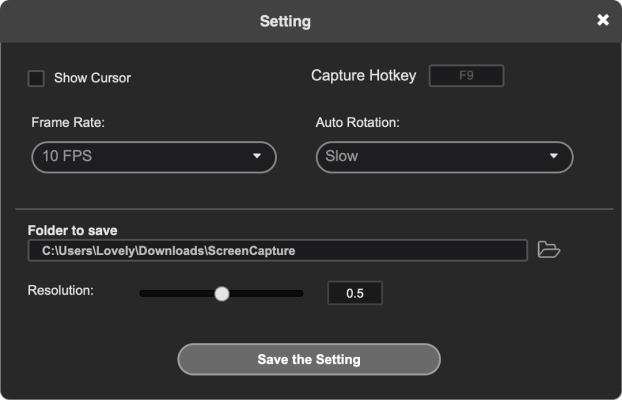
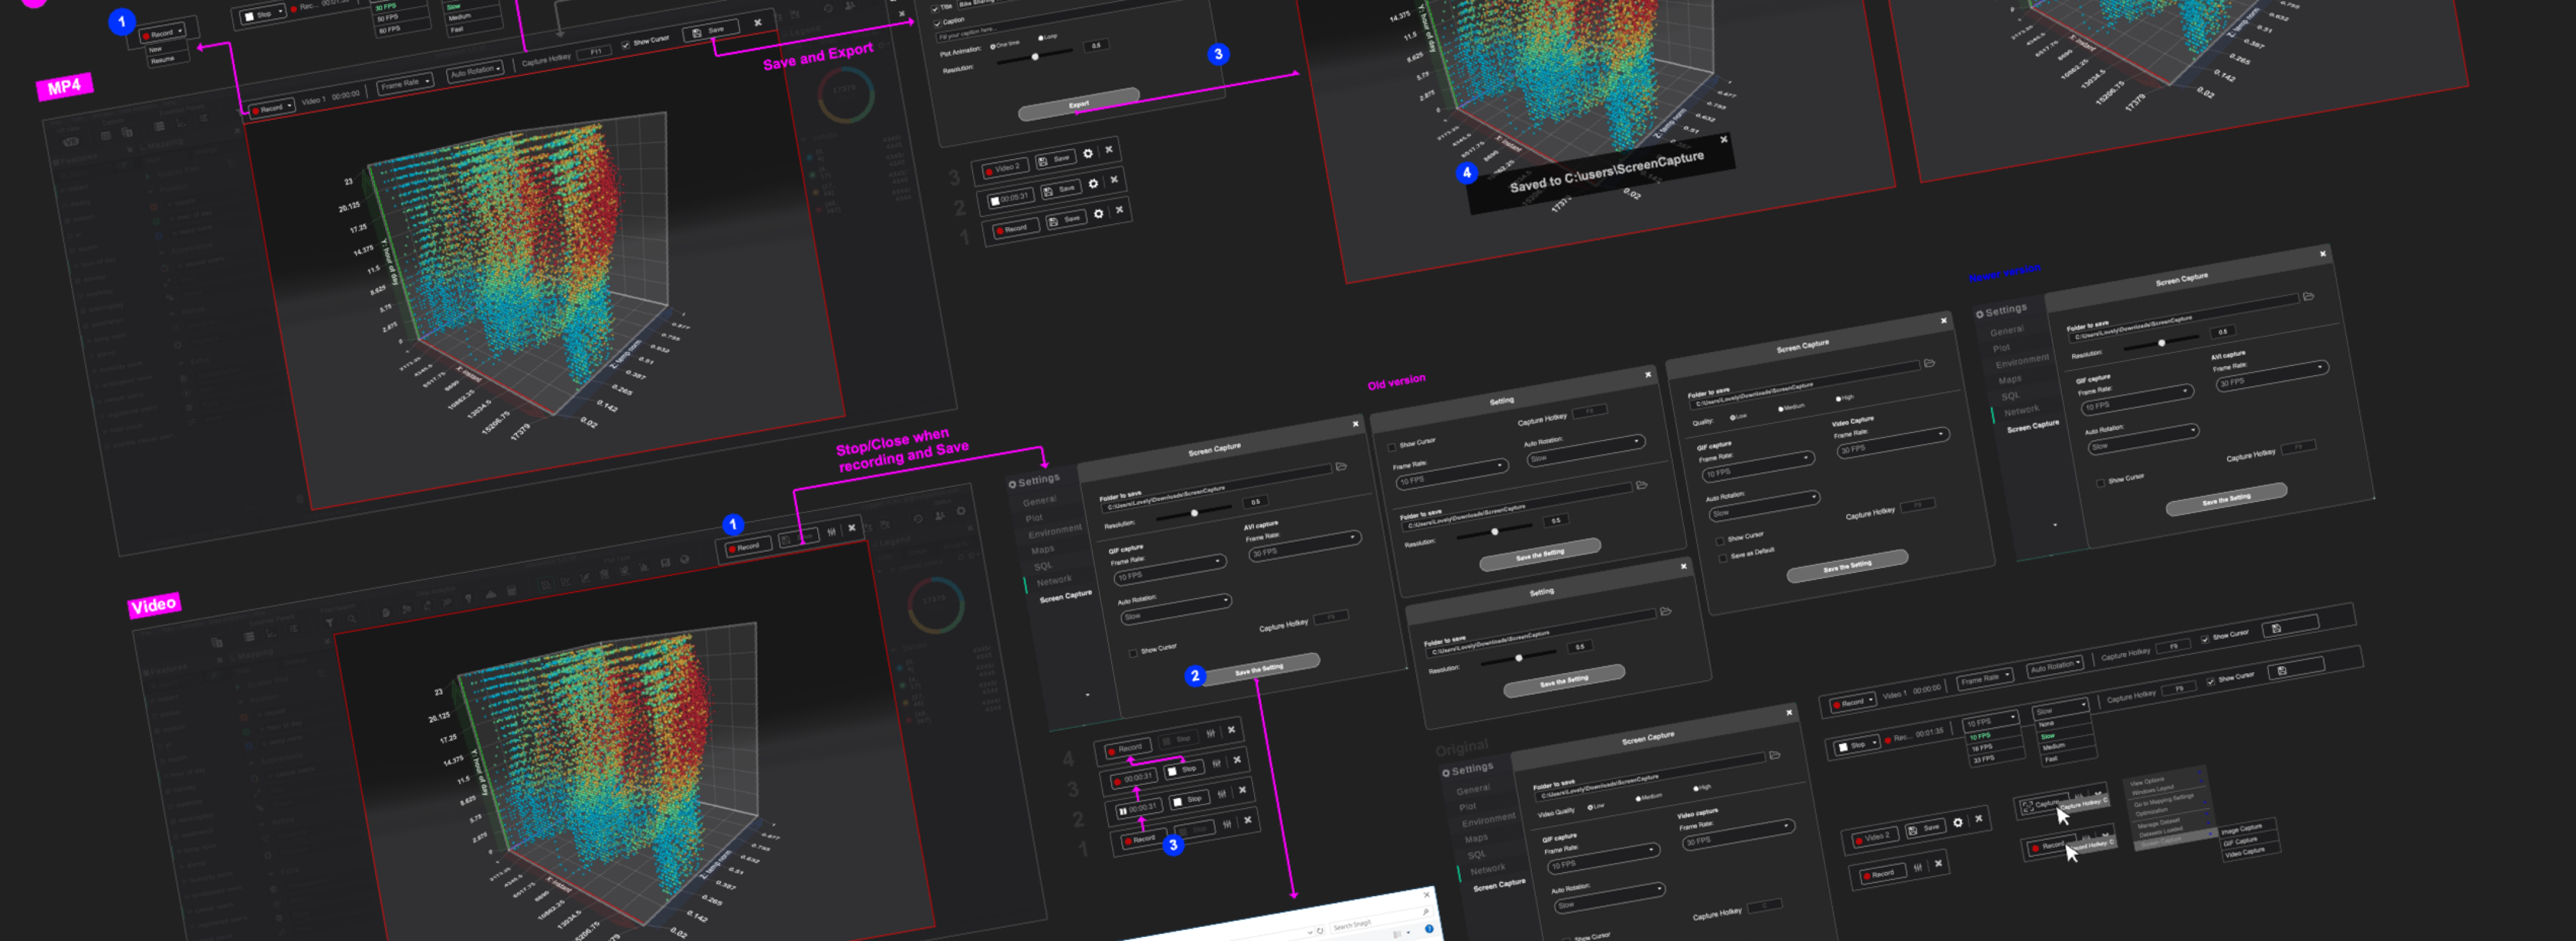
The pop-up export setting was originally set as a separate window with frame rate, rotation, resolution, etc., based on research
After
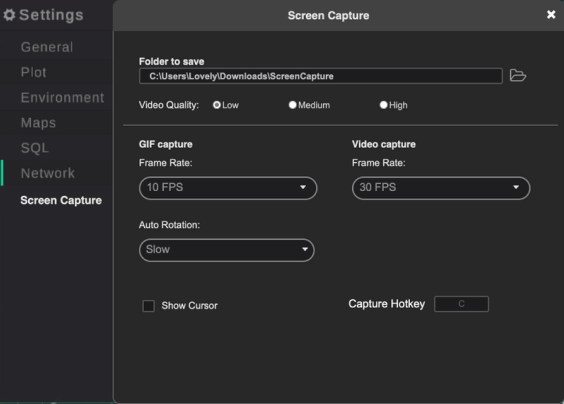
I decided to follow the system guideline and break it into a hierarchical structure based on users' behaviors to make resolutions more understandable
Shorten the user flow for UX & development efficiency
Before
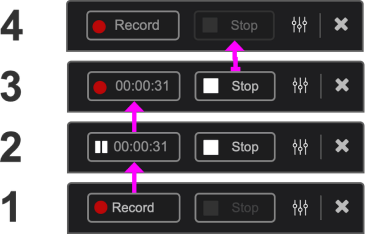
Multiple steps with frame rate, rotation, resolution, etc
After
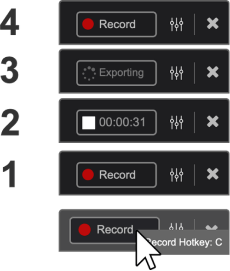
System guideline and break it into a hierarchical structure
Accessibility & cognitive visibility
Before
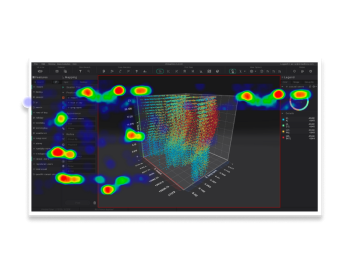
Non-focus of view
After
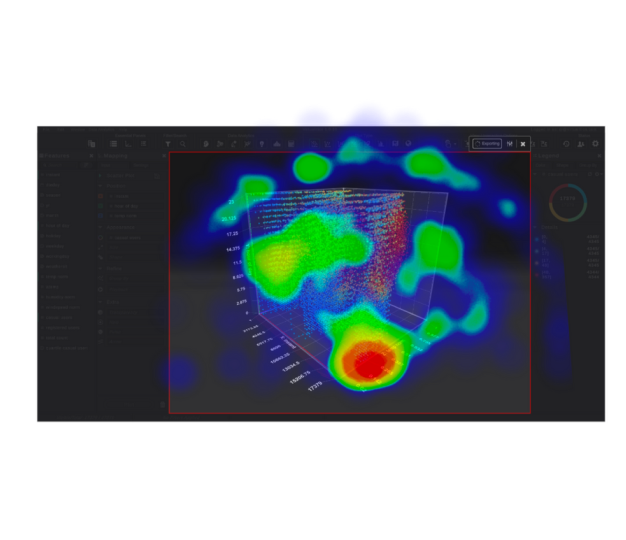
Focused contrast
Build upon customized behaviors
Hotkeys
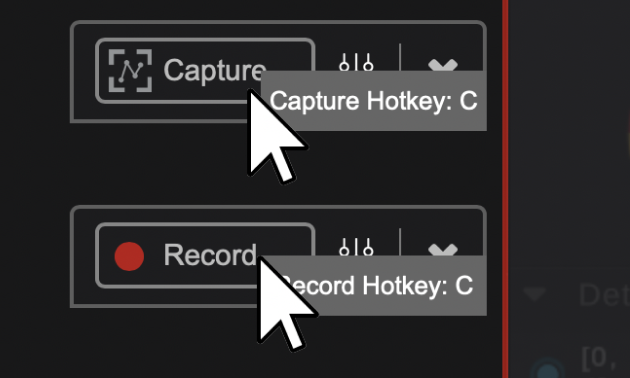
This hover over tooltip helps first time users to find which is the hotkey quickly.
Right Click Quick Access
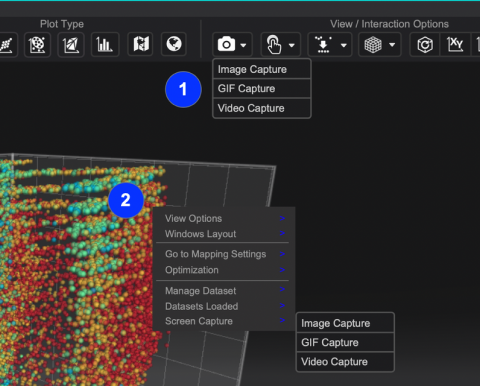
For those users who are used to our system, they love to find quick access by simply right clicking
Launch
Published at investor day
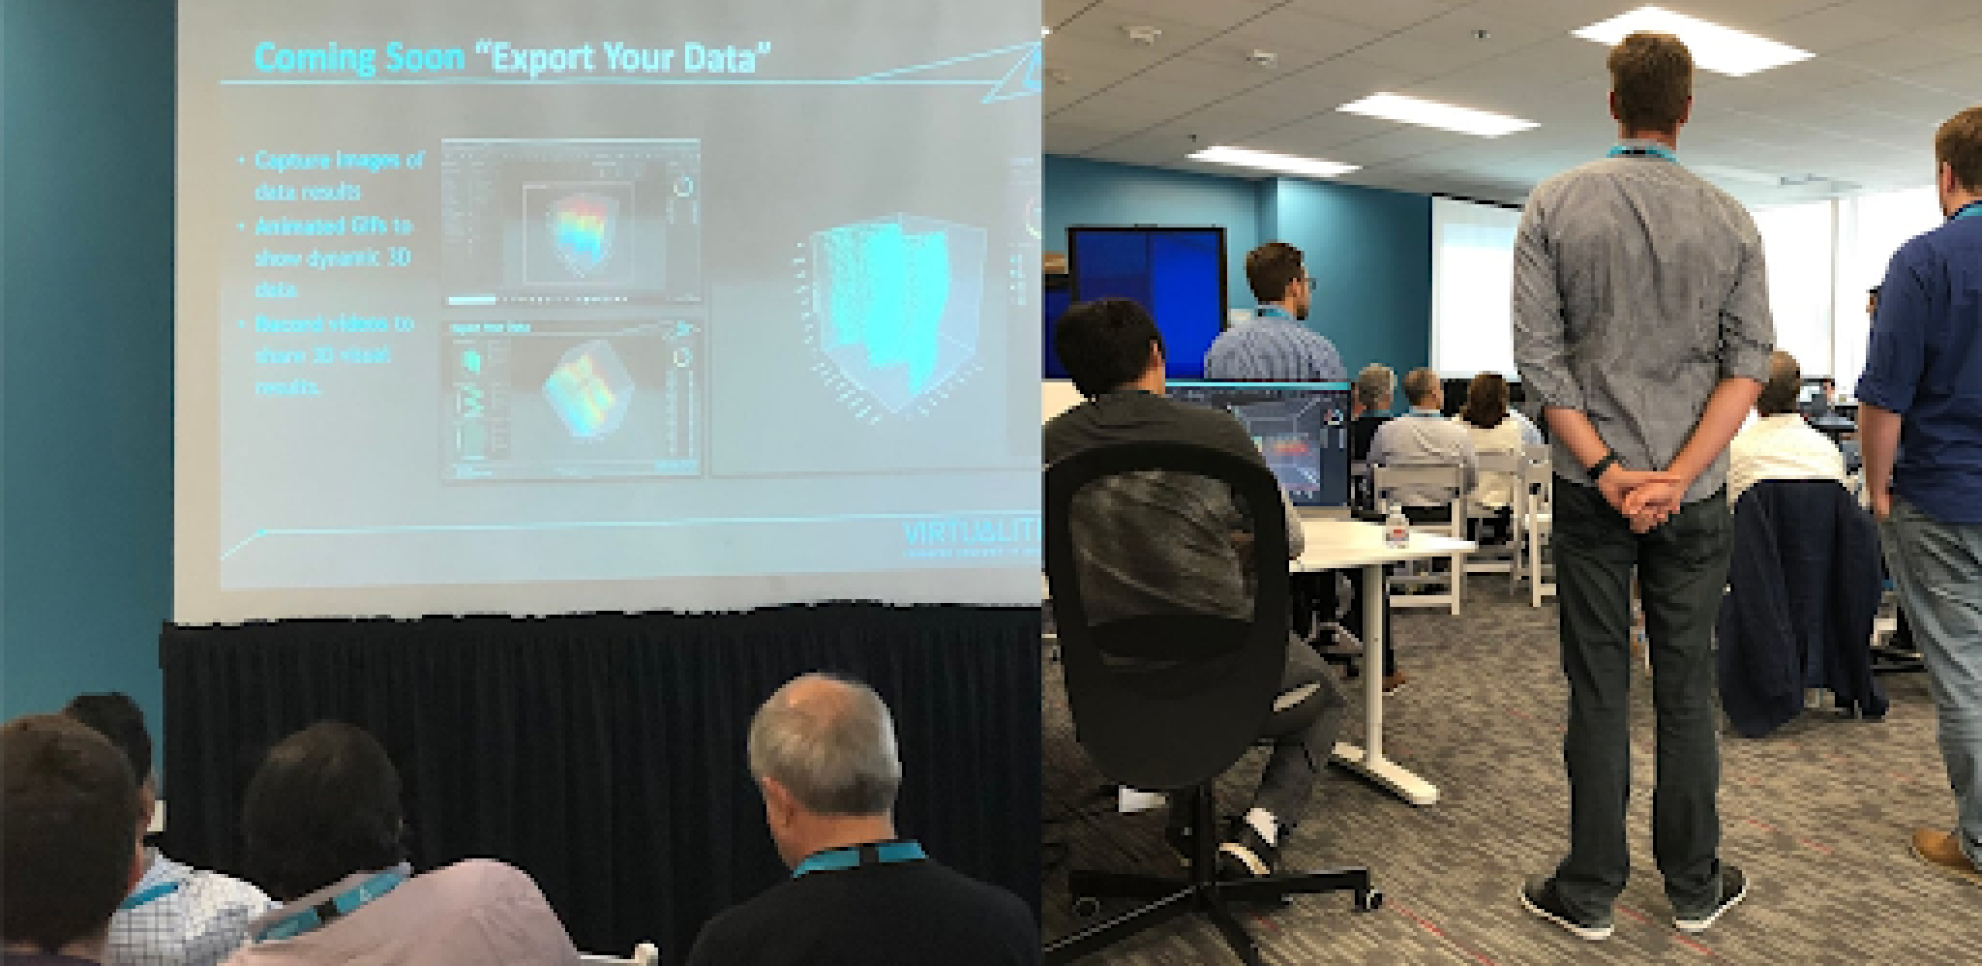
Project 02
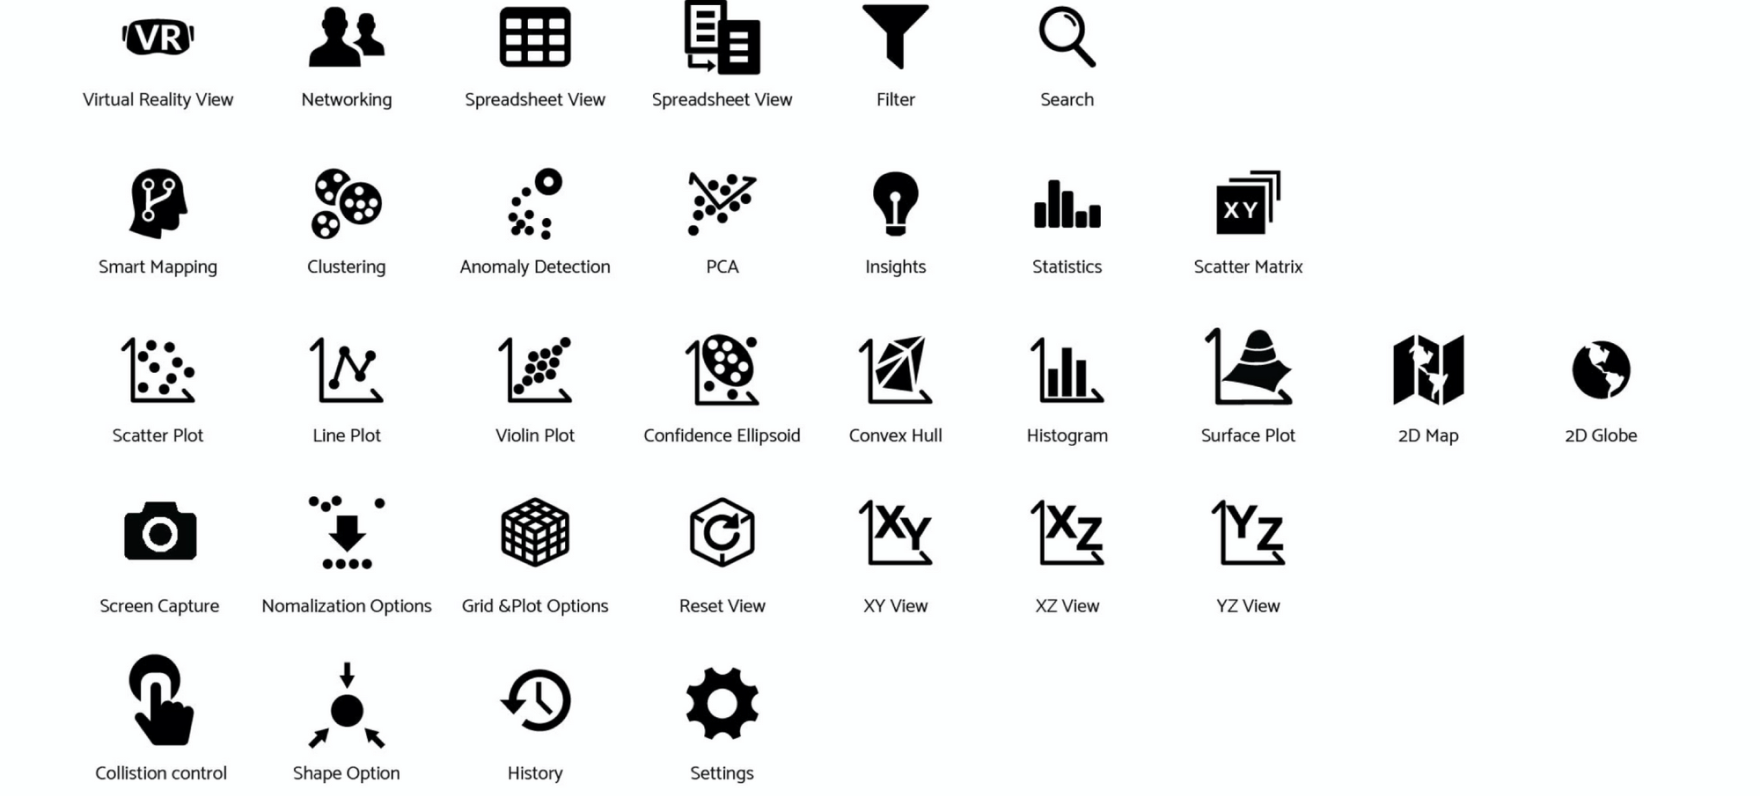
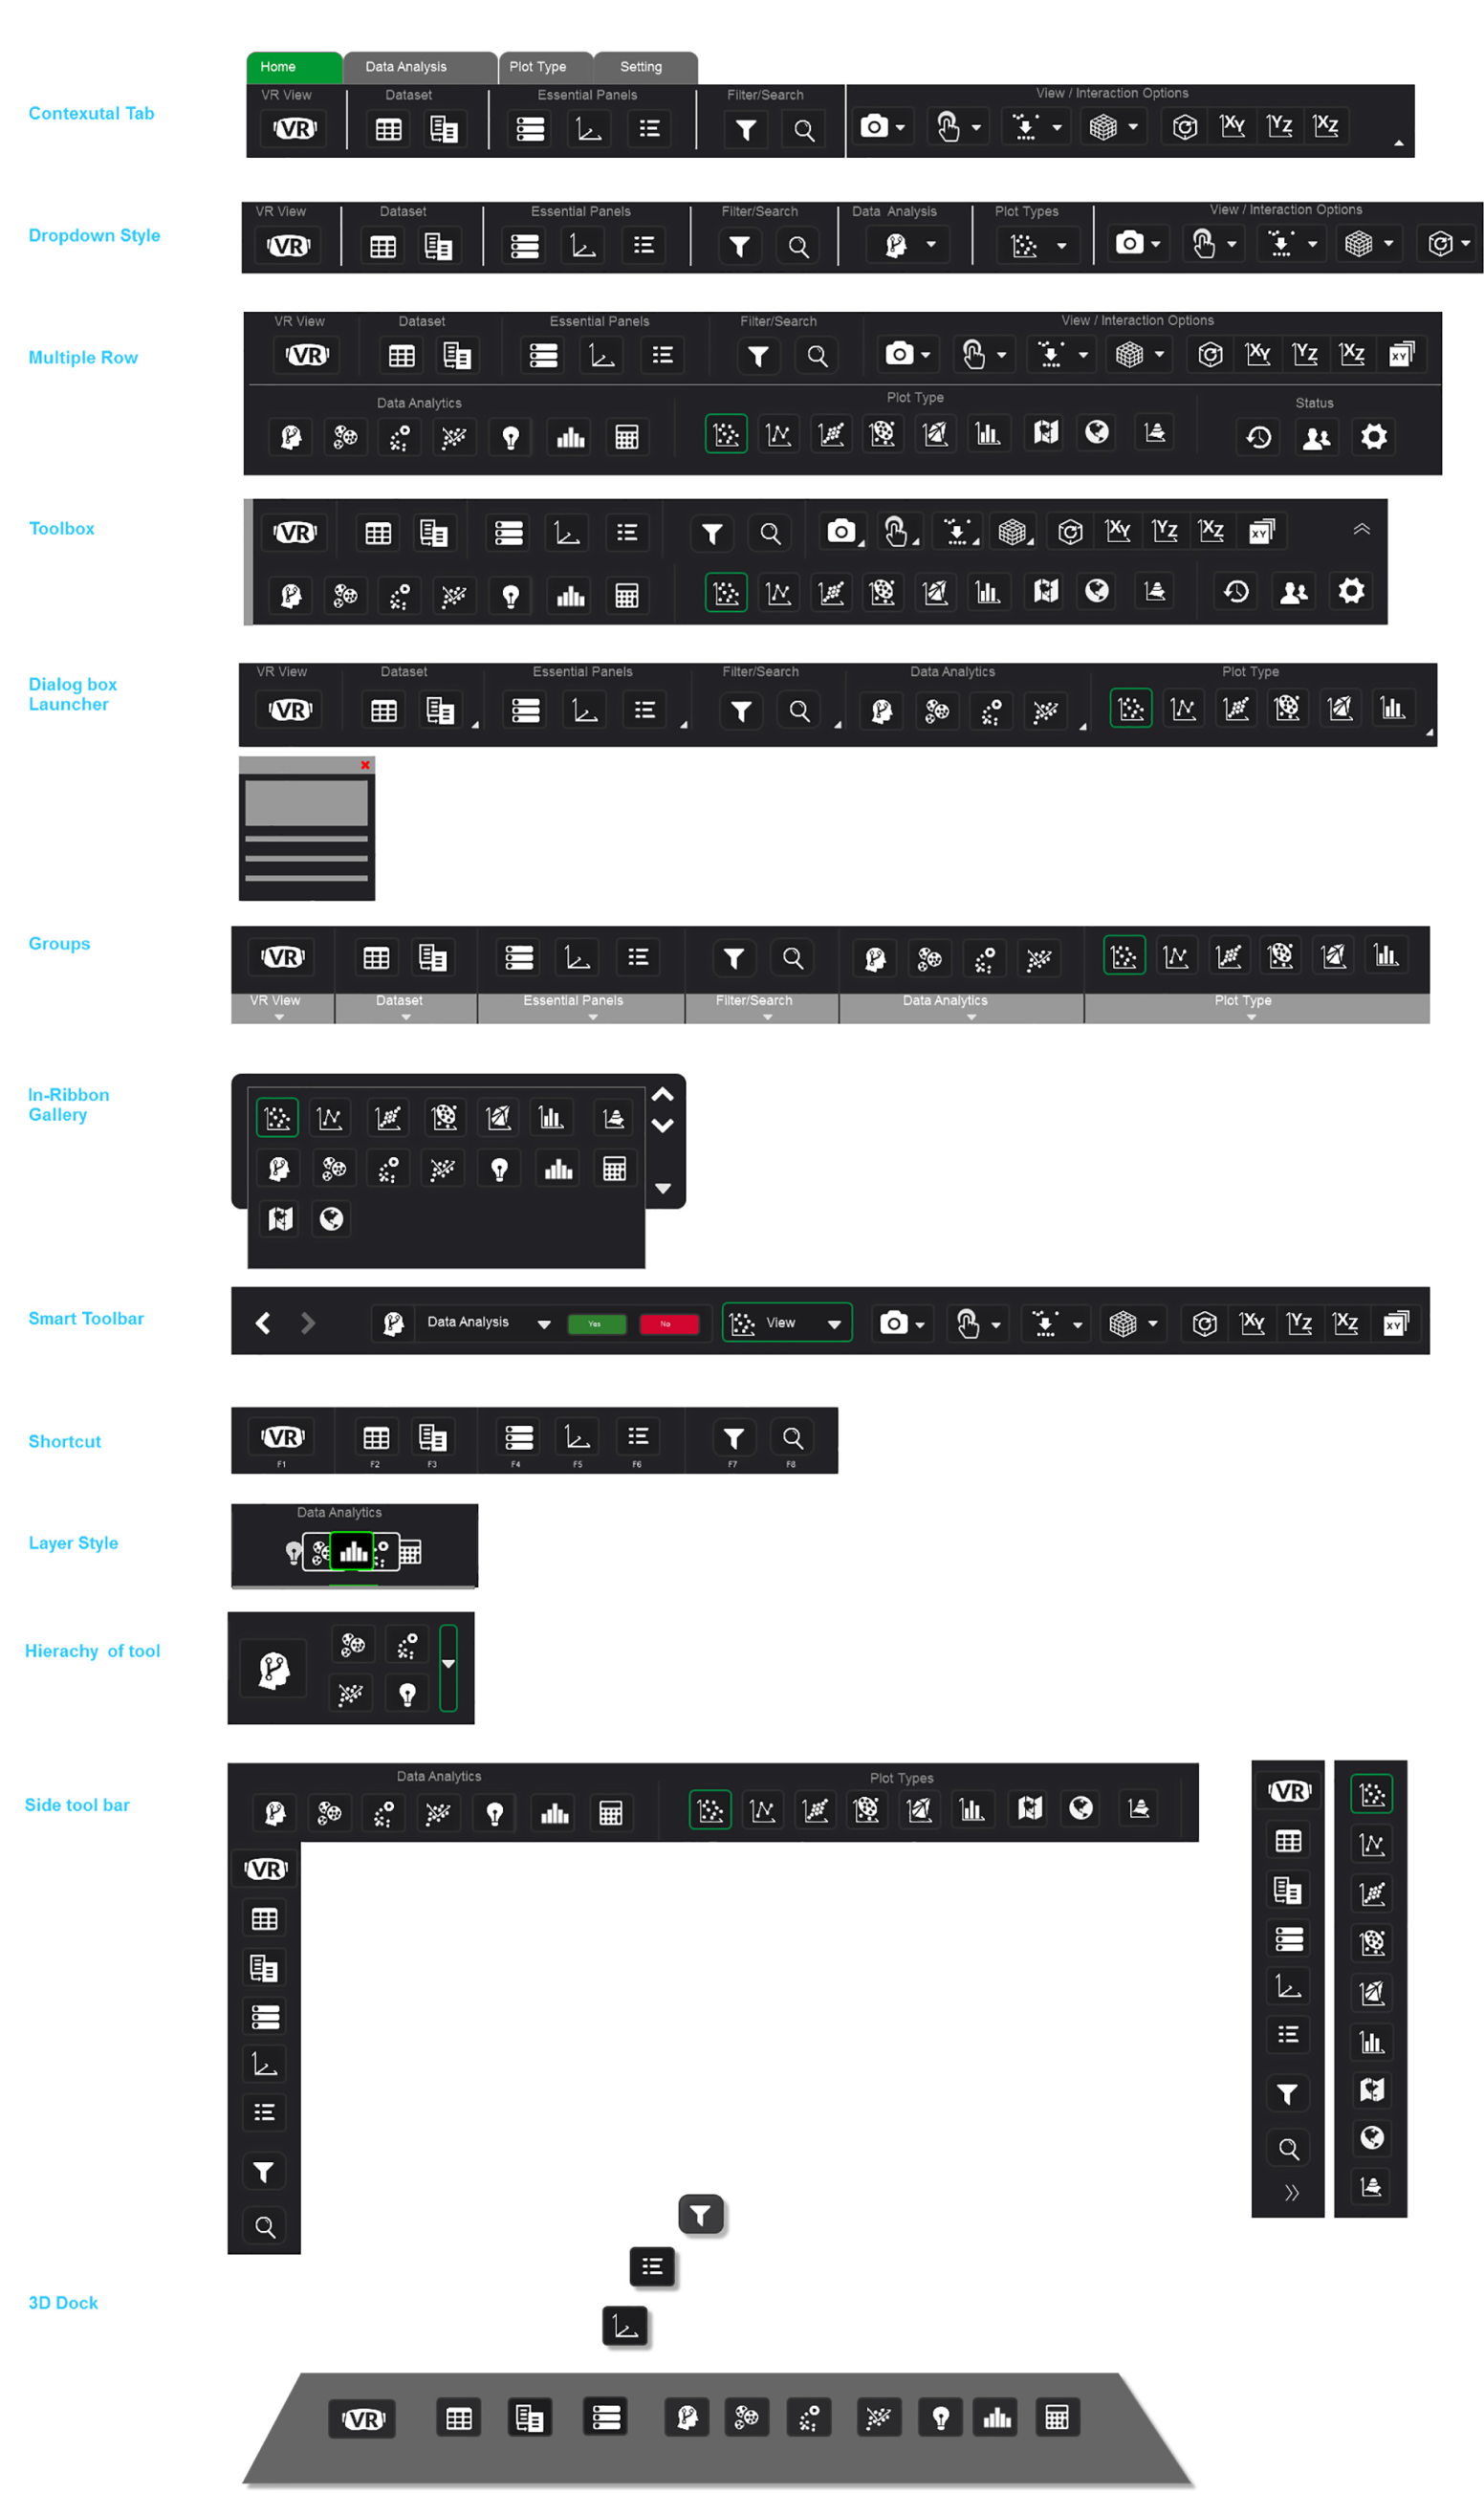
Iterate design components with data scientists
It was getting complex as more tools are added
Project 03
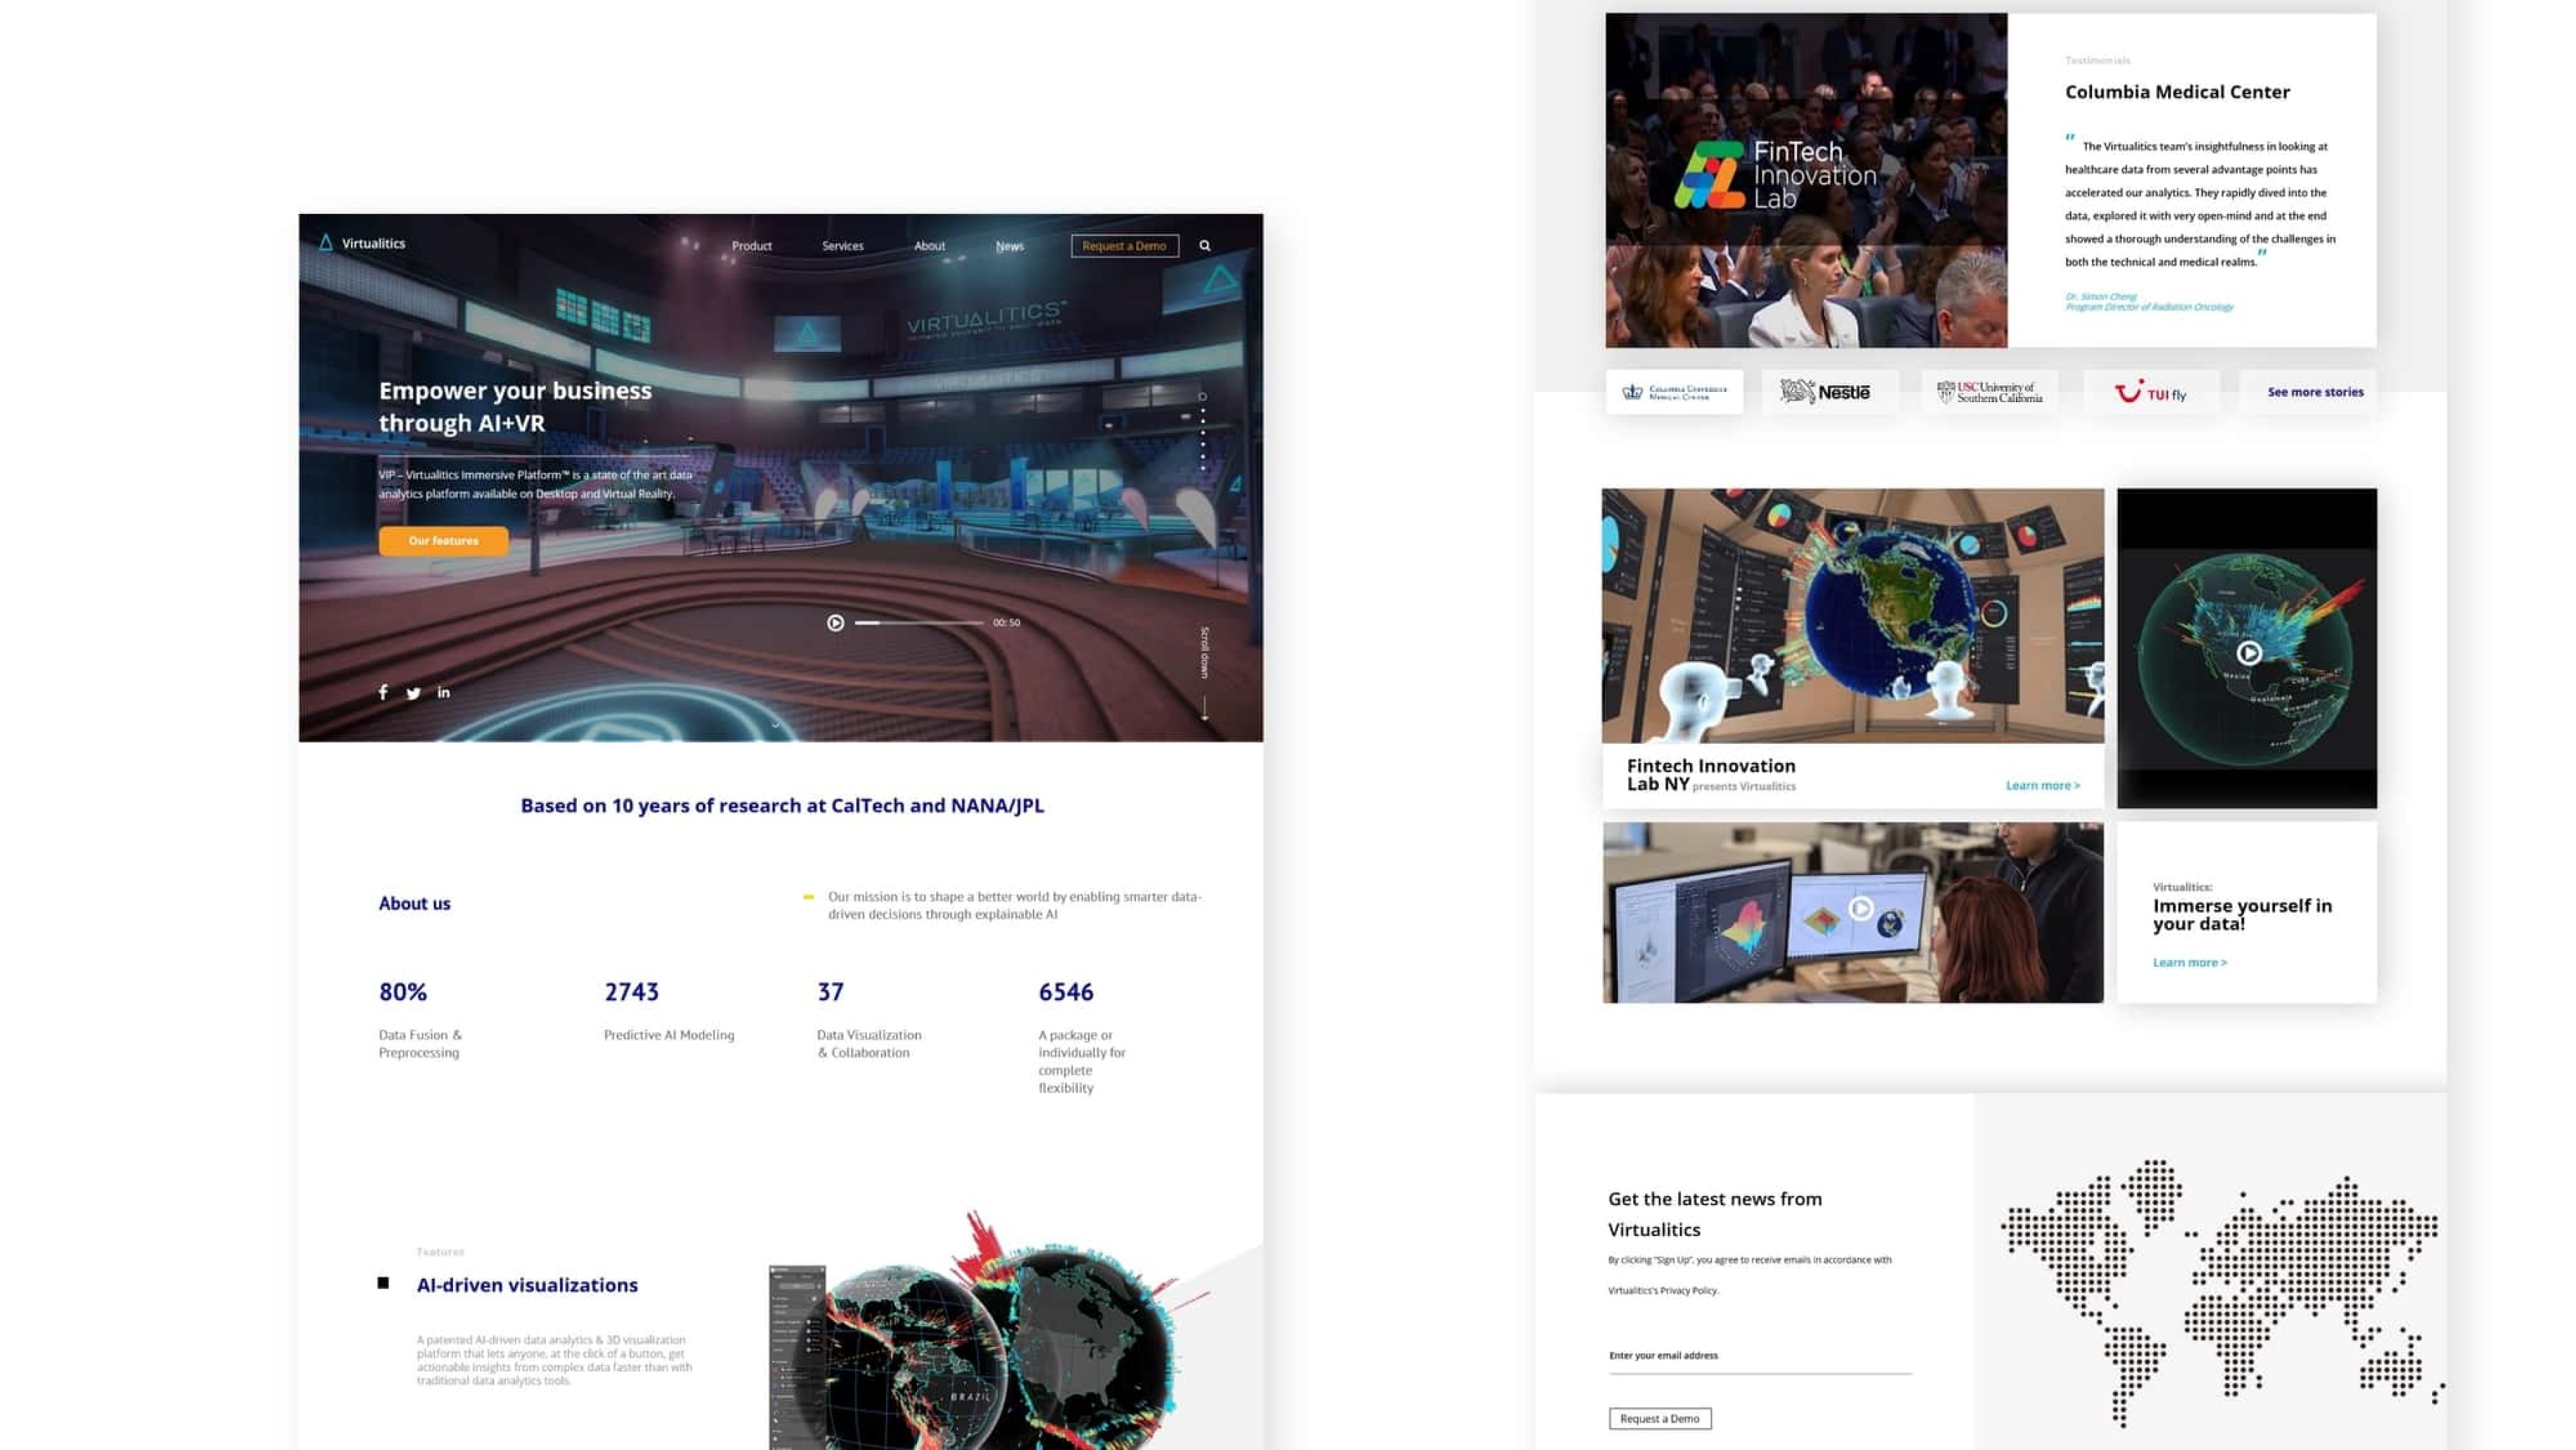
Website redesign
I worked closely with market team on website redesign and documentation on Wordpress. This project lasts about 3 months. It was successfully launching internally.
Reflection
Reflection on my internship
01
Don’t be feature-driven, be user-driven
I was trying to show my logistic thinking when designing a feature. I tried to bring feature to every touchpoint of the use cases. But I realize that user may not really need it when we did testing.
02
Be proactive and collaborate to understand engineering capability
I was trying to bring things to pixel-perfect when presenting to engineer. But the most important thing is to get to the needs and then refine it by different rounds.